KPI Dashboard
This subtab allows the user to add KPI trackers for data points that are real-time in nature, specifically for parameters other than IoT and Quality parameters.
To create a KPI tracker, click on the create custom graph from the top right corner.
This will open a form where you will need to fill the following details:
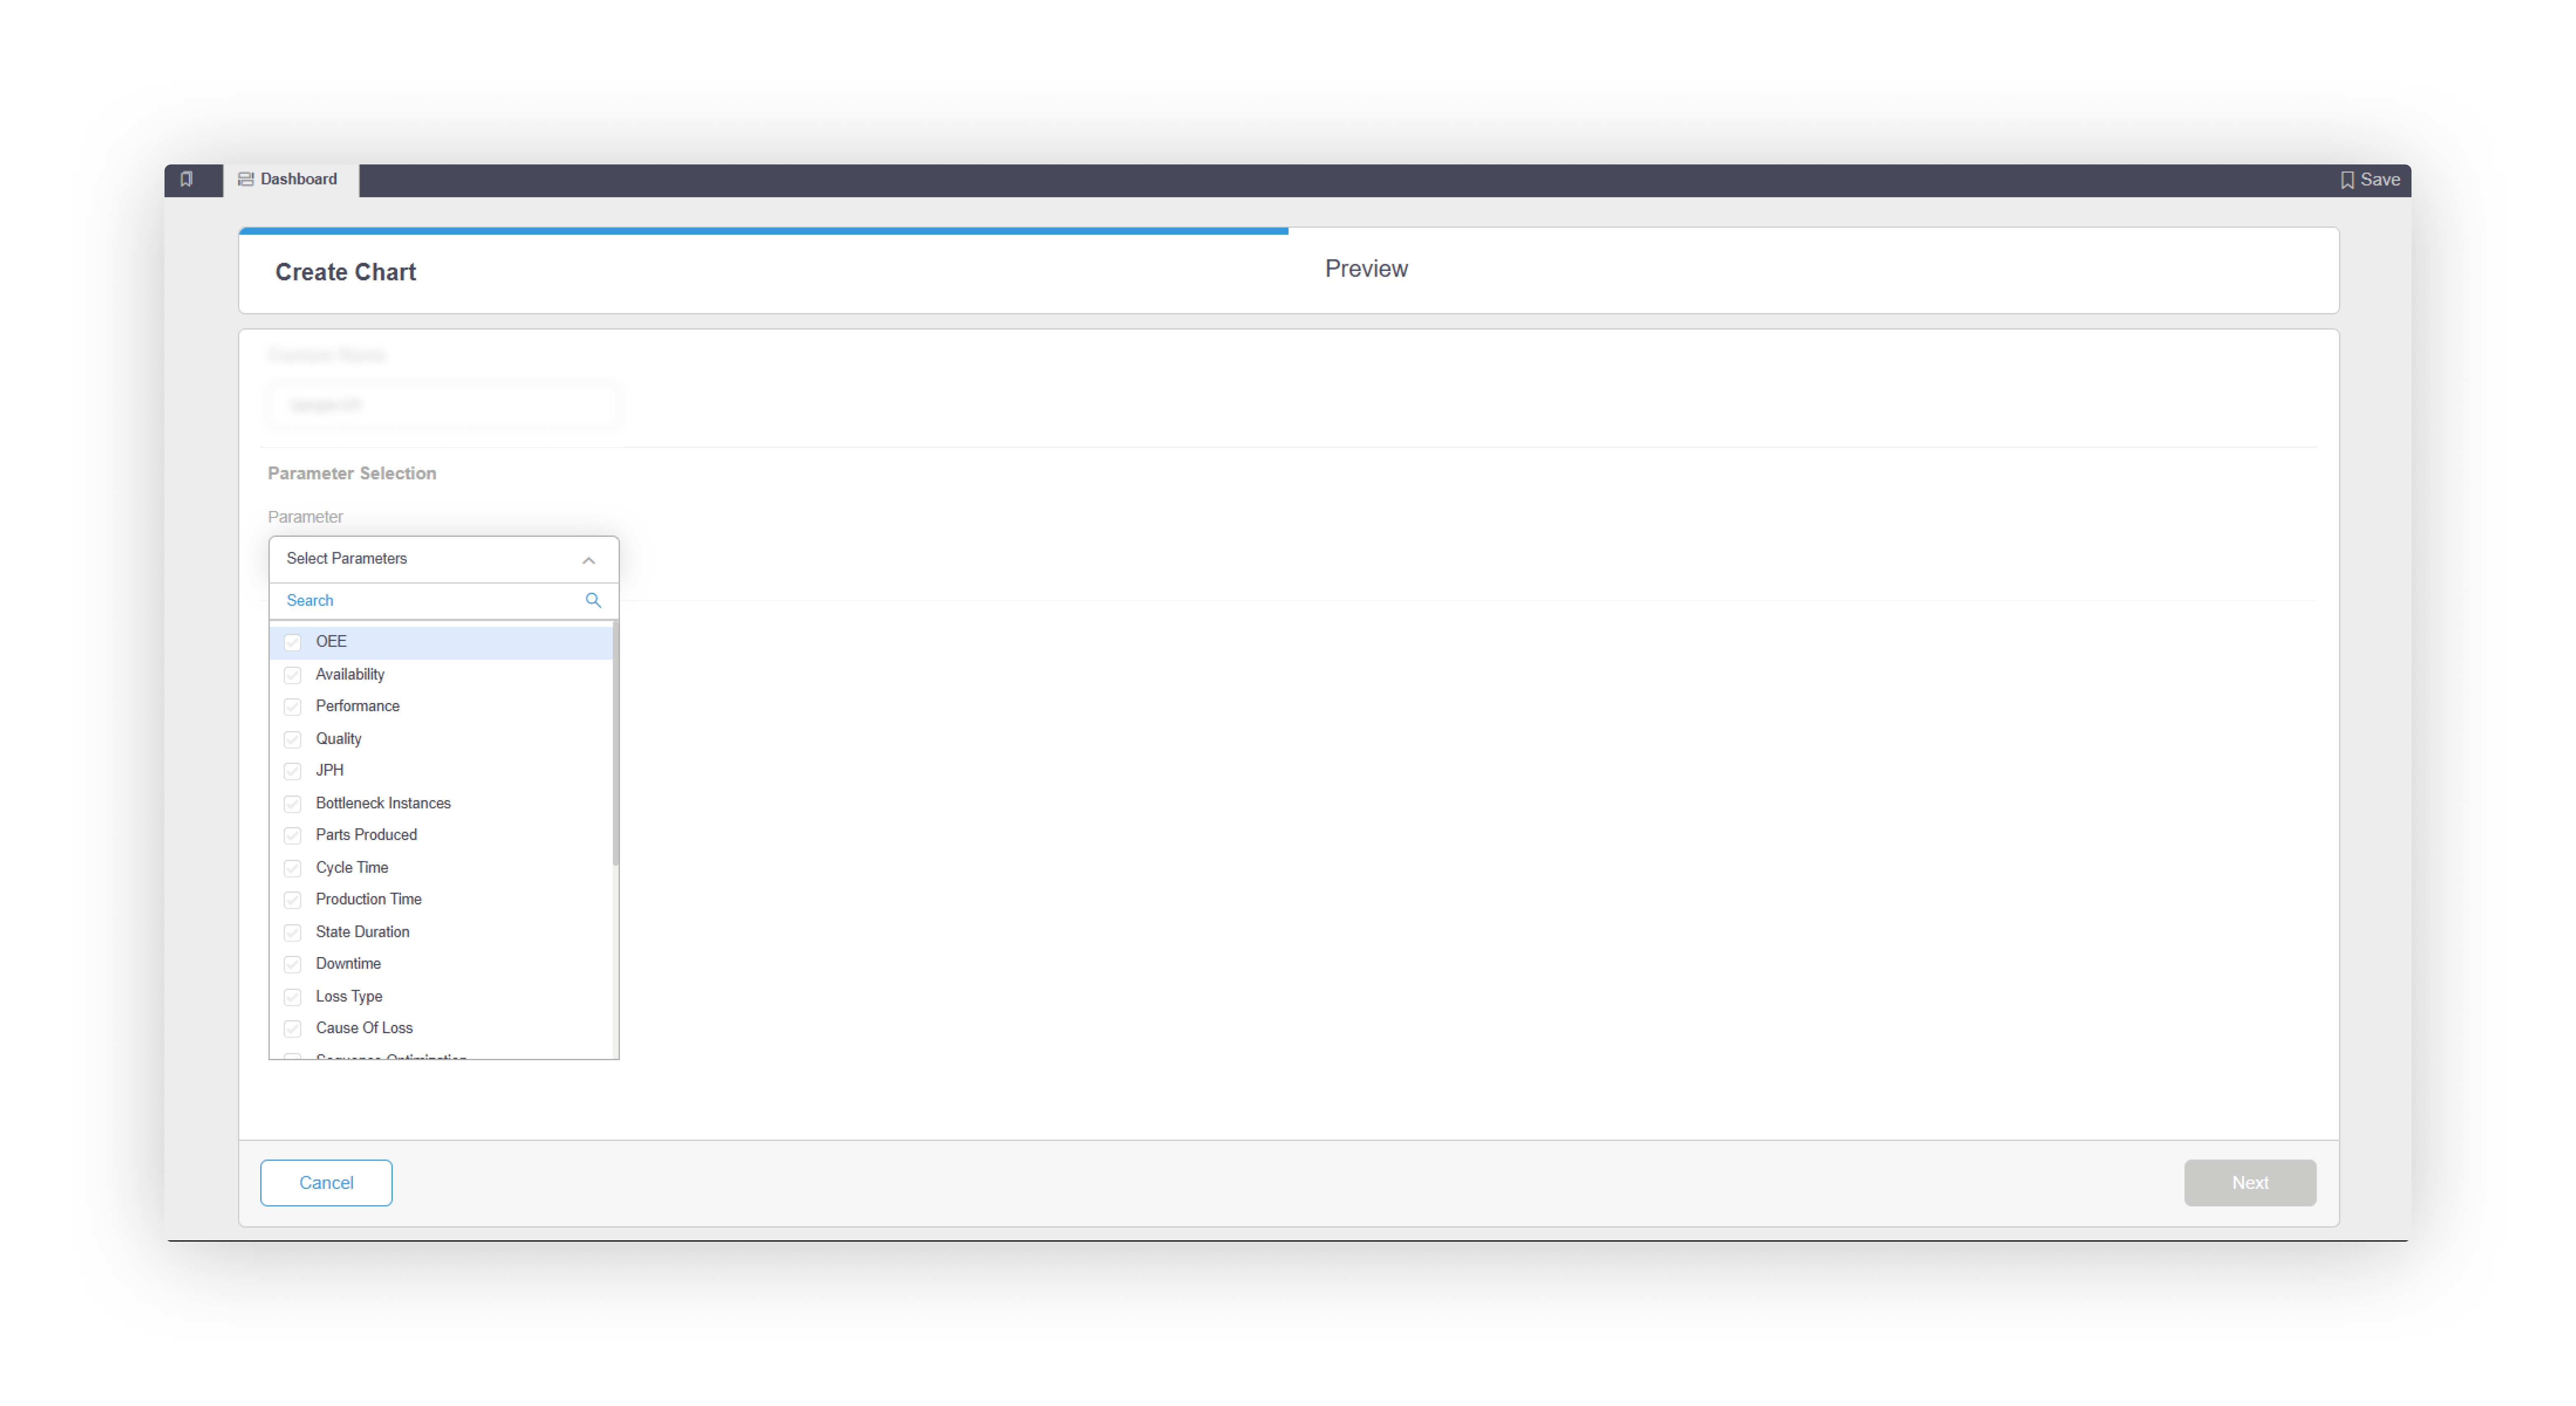
Name of the graph Parameter and Level Selection
Chart Parameter selection for Date range and Chart type
Entity/Machine selection for selecting the desired Machine/Cell/Process IO/ State
OEE
Availability
Total Performance
Self Performance
Availability
Total Performance
Self Performance
Quality
Total Parts Produced
JPH
Bottleneck Instances
Loss Type
Cause of Loss
Cycle Time
Production Time
Down Time
 State Duration
Total Parts Produced
JPH
Bottleneck Instances
Loss Type
Cause of Loss
Cycle Time
Production Time
Down Time
Once the graph is created and save, it will show up directly in your IoT and Quality dashboard. In the event that you would like to edit this graph, you can do so by clicking on the edit icon on the graph itself.
Related Articles
Dashboard
Overview The dashboard provides you with a first glance of the most important data points on your line. These can either be standard KPIs that all lines will track or specific data points that you would like to be able to see at a glance. The top ...Analysis Dashboard
This subtab allows the user to add graphs for data points that are historic in nature. To create a graph, click on the create custom graph from the top right corner. This will open a form where you will need to fill the following details: Name of the ...Template dashboard
Overview Linecraft AI provides a wide range of pre-set templates that you can leverage to create your own template dashboard to monitor and analyze the following parameters: OEE JPH Good part production Overall production MTTR MTBF Downtimes and ...IoT and Quality Dashboard
This subtab allows the user to add graphs for data points that are real-time in nature, specifically for IoT and Quality parameters. To create a graph, click on the create custom graph from the top right corner. This will open a form where you will ...